C++ Systems Engineering
Writing C++ that actually runs on hardware you can hold in your hand. NVIDIA GPU acceleration, concurrent pipelines, and real profiling on constrained embedded systems.
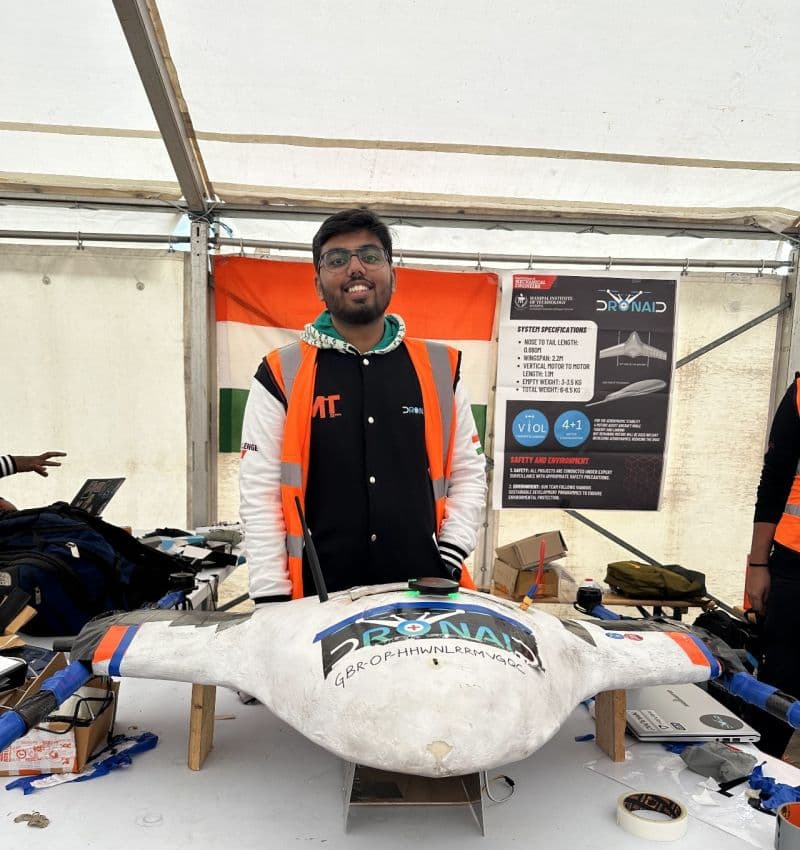
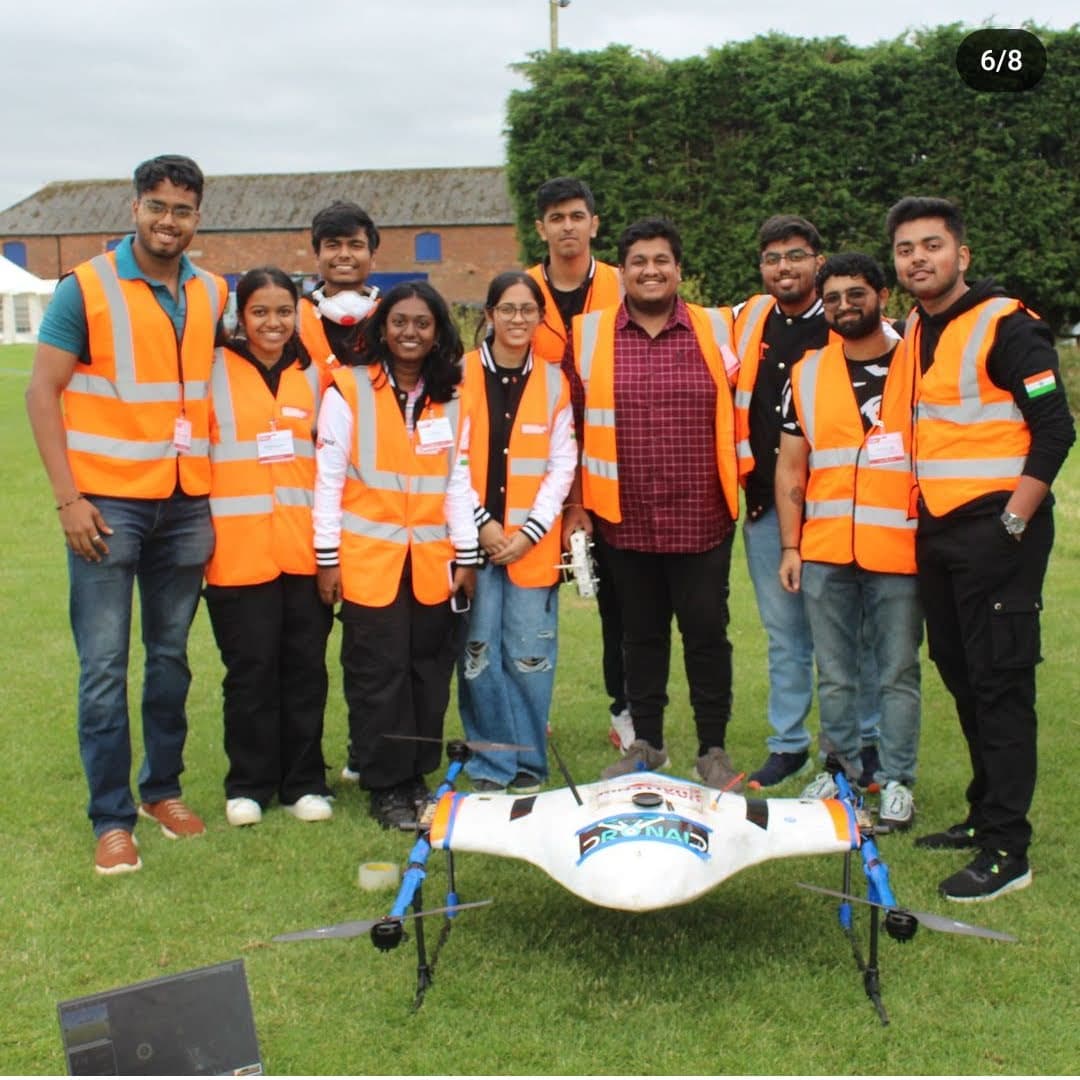
Dronaid
Software Engineer | Manipal, India
Jul 2022 – Sep 2023
Computer Vision on Edge
Rewrote the perception pipeline from Python to C++. YOLO went from 5 to 12 FPS once I added TensorRT, CUDA acceleration, and async execution. That jump felt really good to see.
Real-time Perception
Built the camera capture, video streaming and sensor processing in C++ using OpenCV, V4L2 and ROS. Used smart pointers and RAII throughout so memory issues didn't creep in during long runs.
Embedded Systems
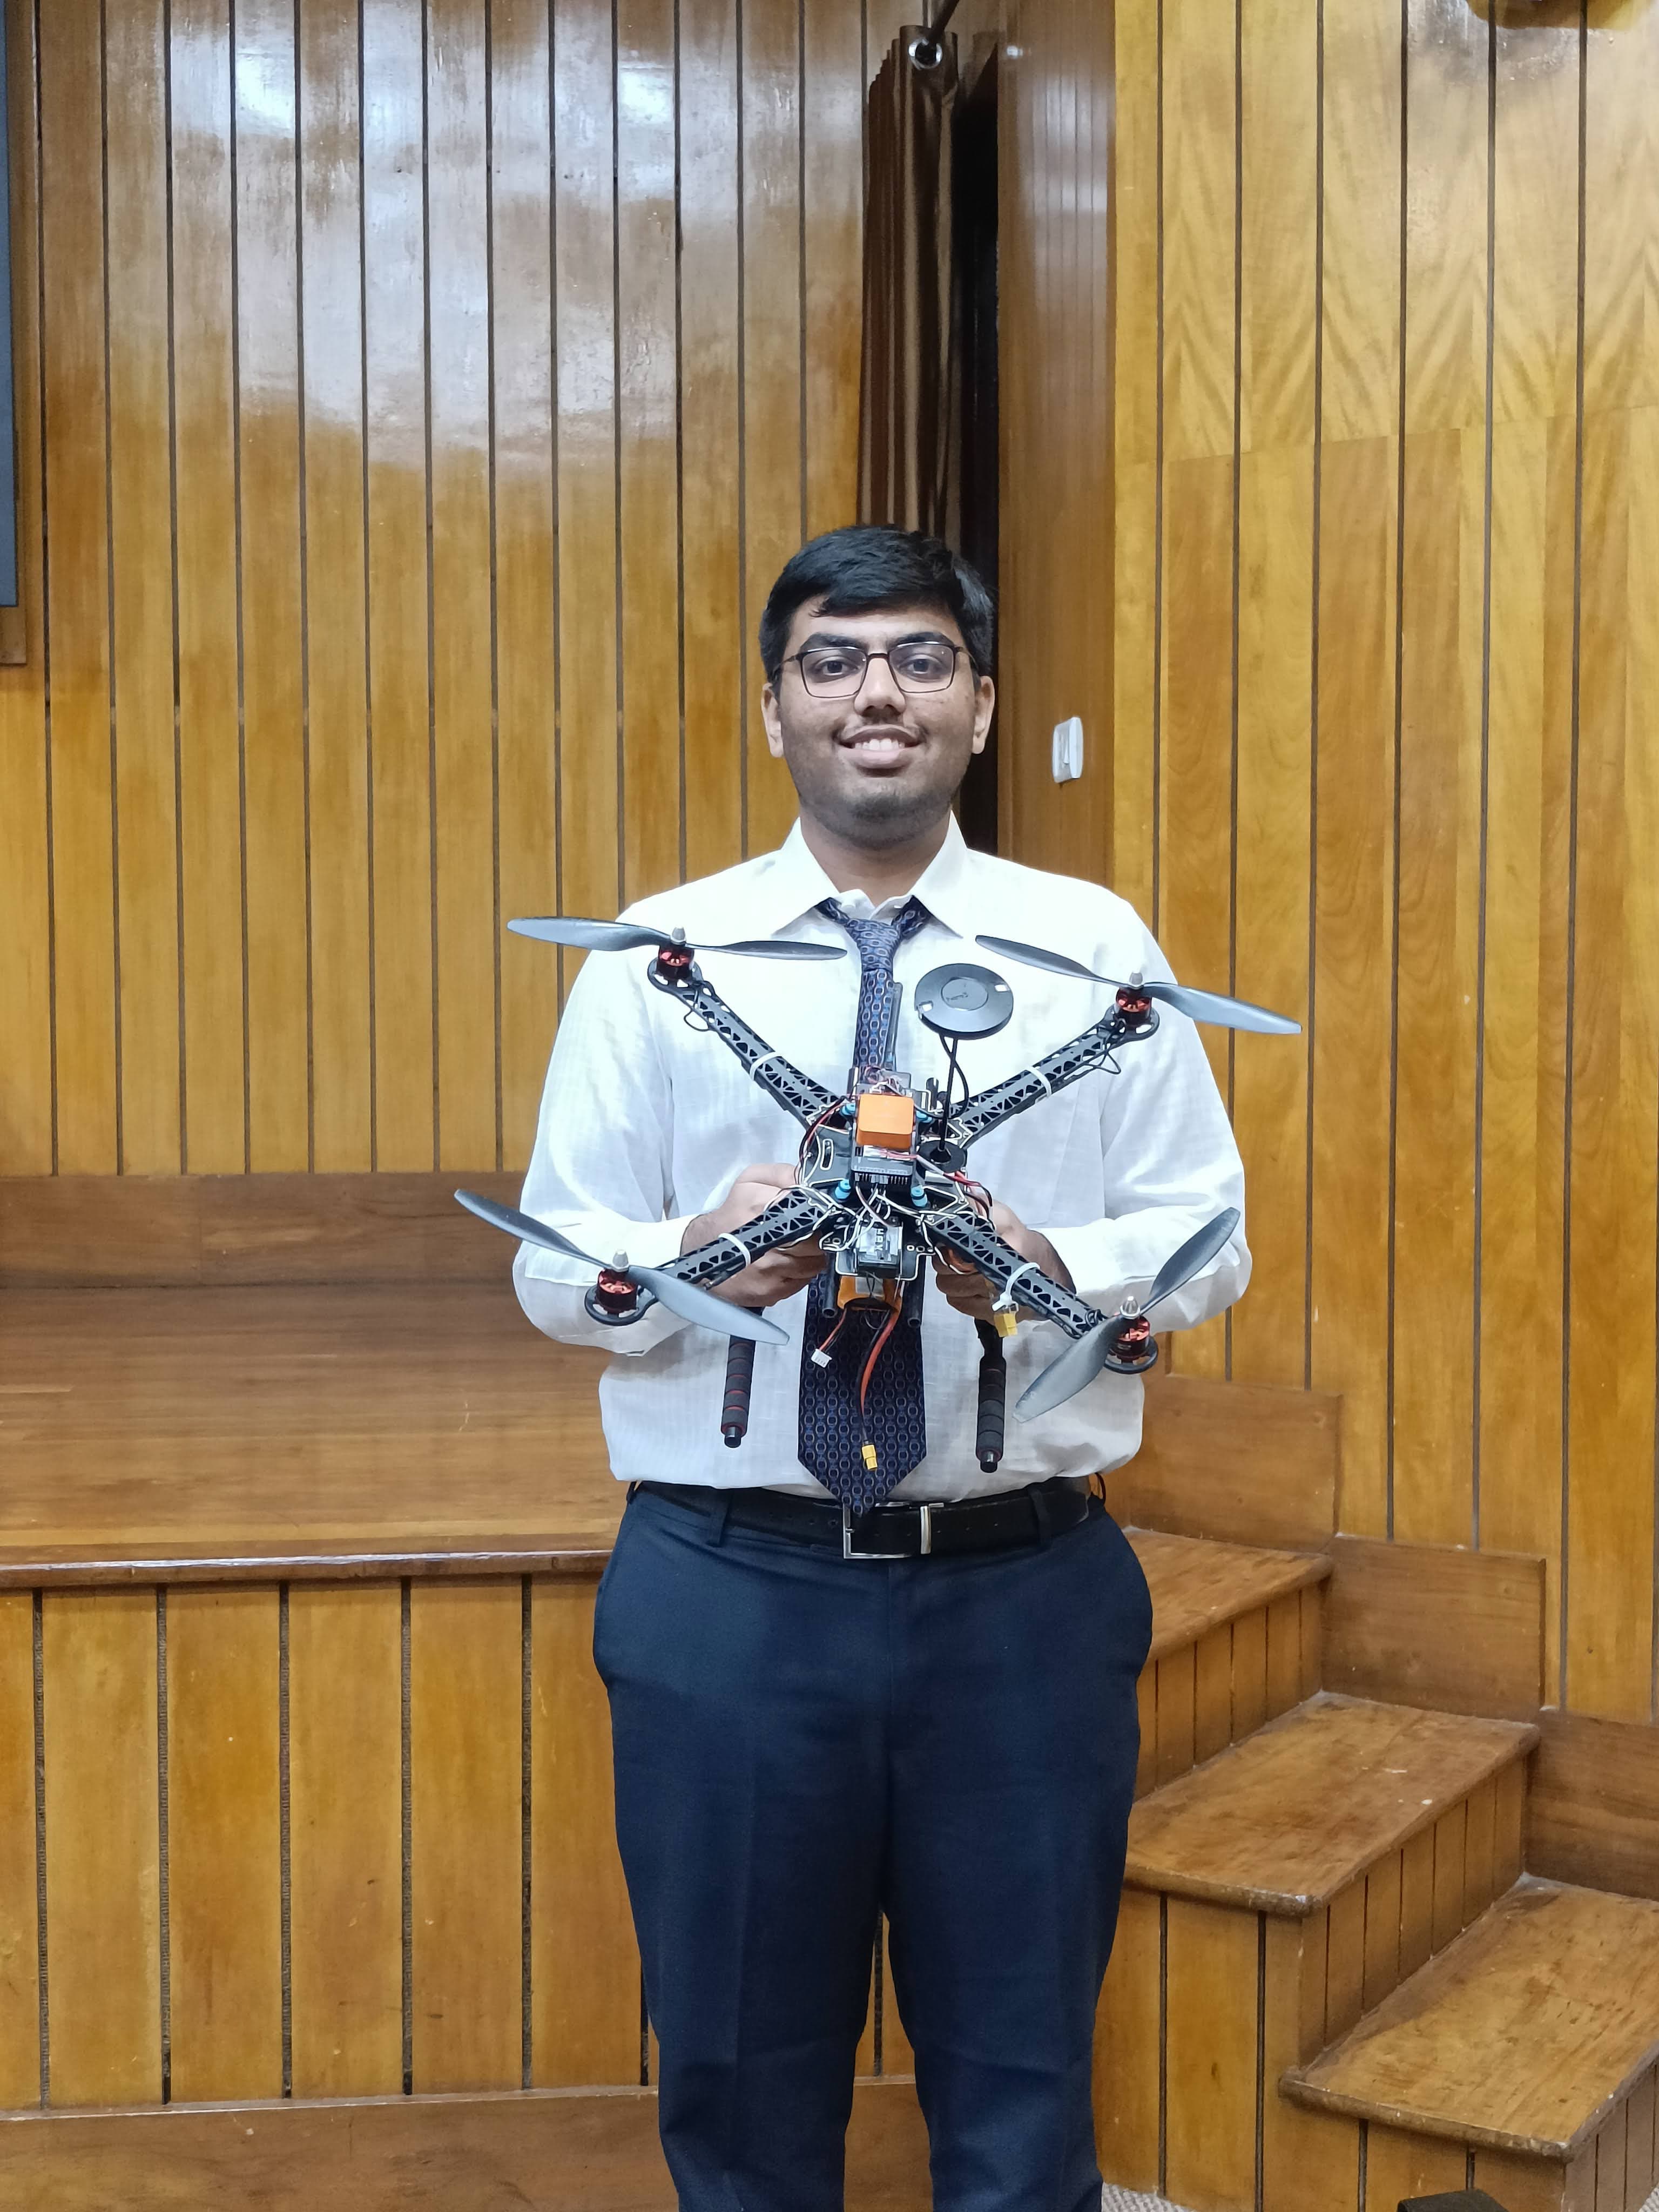
Got the whole stack running on a Jetson Nano and Raspberry Pi, with camera, LiDAR and GPS feeding into ROS pipelines that ran unattended on Ubuntu. Lots of debugging on actual hardware.
Performance Engineering
Used NSight Systems, the TensorRT profiler and Linux perf to find where time was actually going. Most of the wins came after pinning down specific GPU memory and I/O stalls.
C++ Systems Development
Kept the codebase modular with CMake and separated capture, preprocessing and inference into independent components. OpenMP handled the concurrency so frame rates stayed stable over hours.
GPU Acceleration on Embedded Hardware
Running inference on a Jetson Nano teaches you to care about every millisecond and every byte of VRAM. Here is what I actually used from the NVIDIA toolchain to get the most out of that little board.
TensorRT Optimization
Converted the YOLO models to TensorRT engines using FP16, with layer fusion and INT8 calibration. Accuracy barely moved but latency dropped a lot, which was the whole point on embedded hardware.
CUDA Acceleration
Moved image decoding, normalization and NMS into CUDA kernels so the pipeline stayed on the GPU without constantly bouncing data back to the CPU. That alone got rid of a lot of stall time.
NVIDIA NSight Profiling
NSight Systems and the TensorRT profiler showed me the actual kernel timelines, so I could see exactly where DRAM bandwidth was getting hit. Cross-checked everything with Linux perf on the CPU side.
Async Pipeline Design
The biggest win was splitting capture, preprocessing and inference into separate concurrent threads connected by producer-consumer queues. That way the GPU is never sitting idle waiting on the camera, and the camera is never blocked waiting on inference. Smart pointers handle the frame buffers and RAII cleans everything up properly, even when things crash mid-run.
C++ Parallel Programming
Coursework that covered the full range of parallel computing: shared-memory C++ concurrency, distributed HPC with MPI, and GPU kernel tuning. A lot of what I learned here directly applied to the Dronaid work.
Concurrent C++ Programs
Wrote multi-threaded programs from scratch using mutexes, condition variables and atomics. Spent a lot of time debugging deadlocks before I got the patterns right. Lock-free queues and thread pools were the main focus.
OpenMP & MPI
Parallelized shared-memory programs with OpenMP and wrote distributed programs with MPI. Plotting speedup vs. thread count and watching where Amdahl's Law kicks in is genuinely interesting.
CUDA Kernel Optimization
Learned to look at memory coalescing, shared memory tiling, occupancy and warp divergence to understand why a kernel is slow. The same thinking I later used when debugging TensorRT inference at Dronaid.
AI for Robotics & Vision-Language-Action Models
State Estimation & Planning
Completed advanced robotics curriculum under Prof. Dieter Fox, implementing EKF-SLAM, UKF, particle filters and sampling-based planners (RRT, PRM) with RL control policies.
Graph & Geometry Algorithms
Implemented graph-search planning (A*, Dijkstra) and computational-geometry primitives for trajectory optimization, occupancy-grid mapping and road-network topology analysis.
Foundation Models
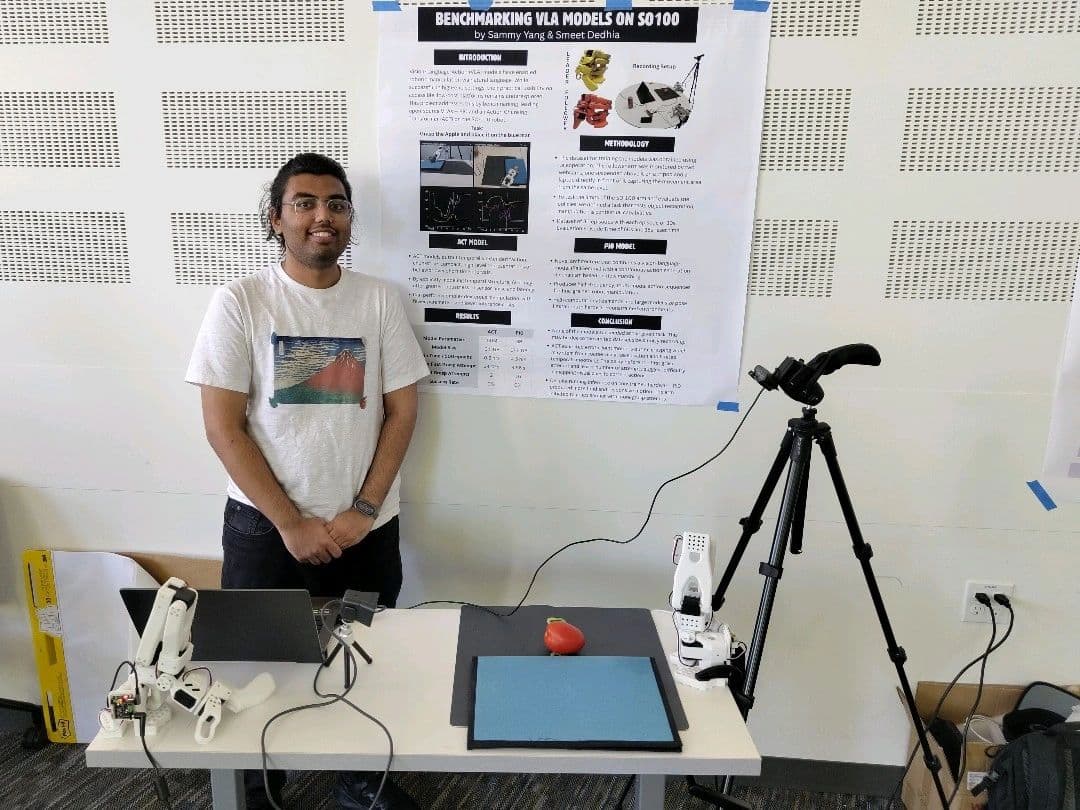
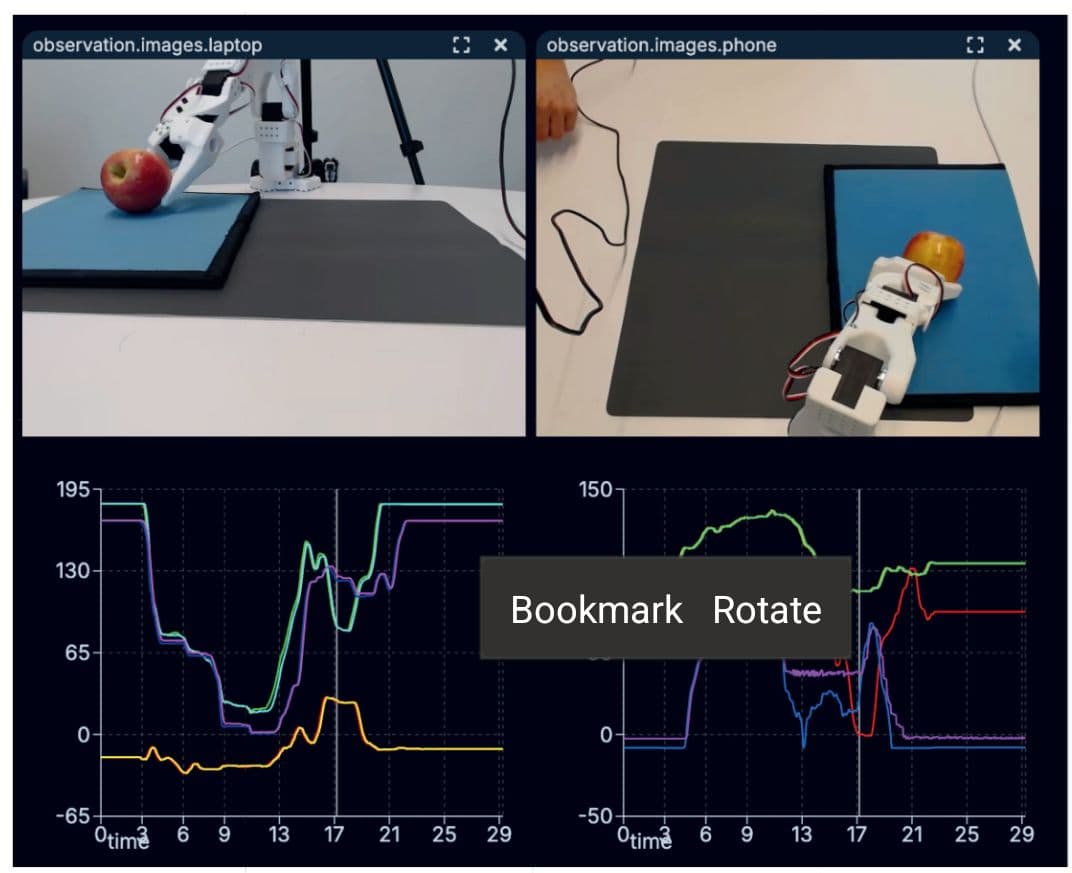
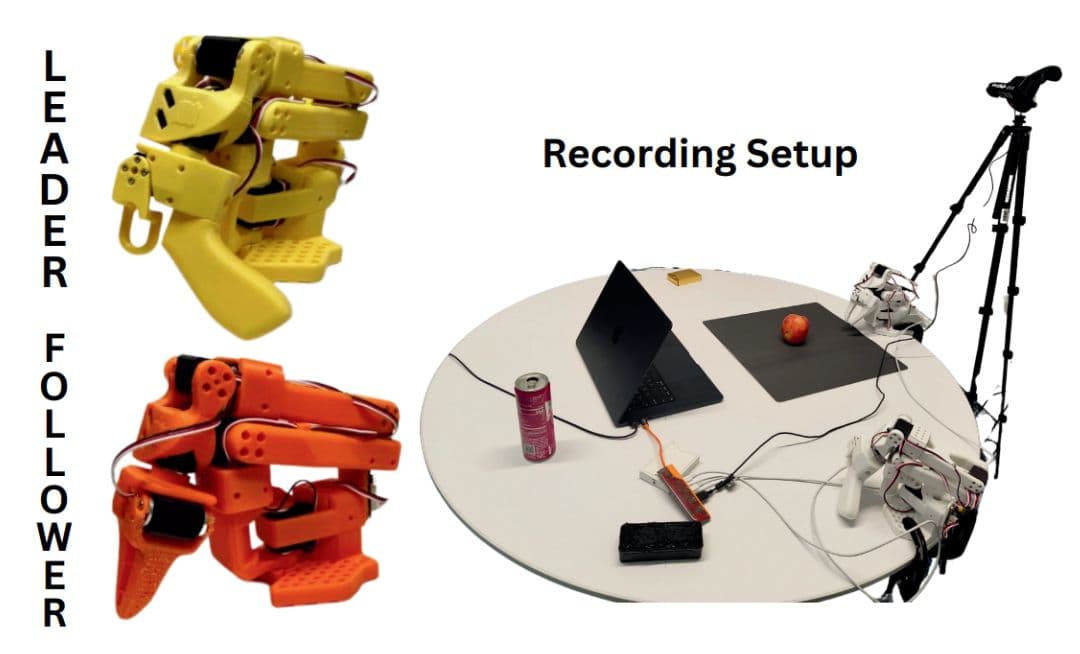
Benchmarked VLA & robotics foundation models on the LeRobot-So-100 arm, analyzing generalization, task transfer and VLA training for mapping vision + language to action.
Low-Level Optimization Across Projects
I find myself doing this kind of work regardless of language. Whether it is C++ on embedded hardware, Python inference on a GPU cluster, or SQL going through a query planner, the approach is pretty much the same: figure out what is actually slow, then fix that.
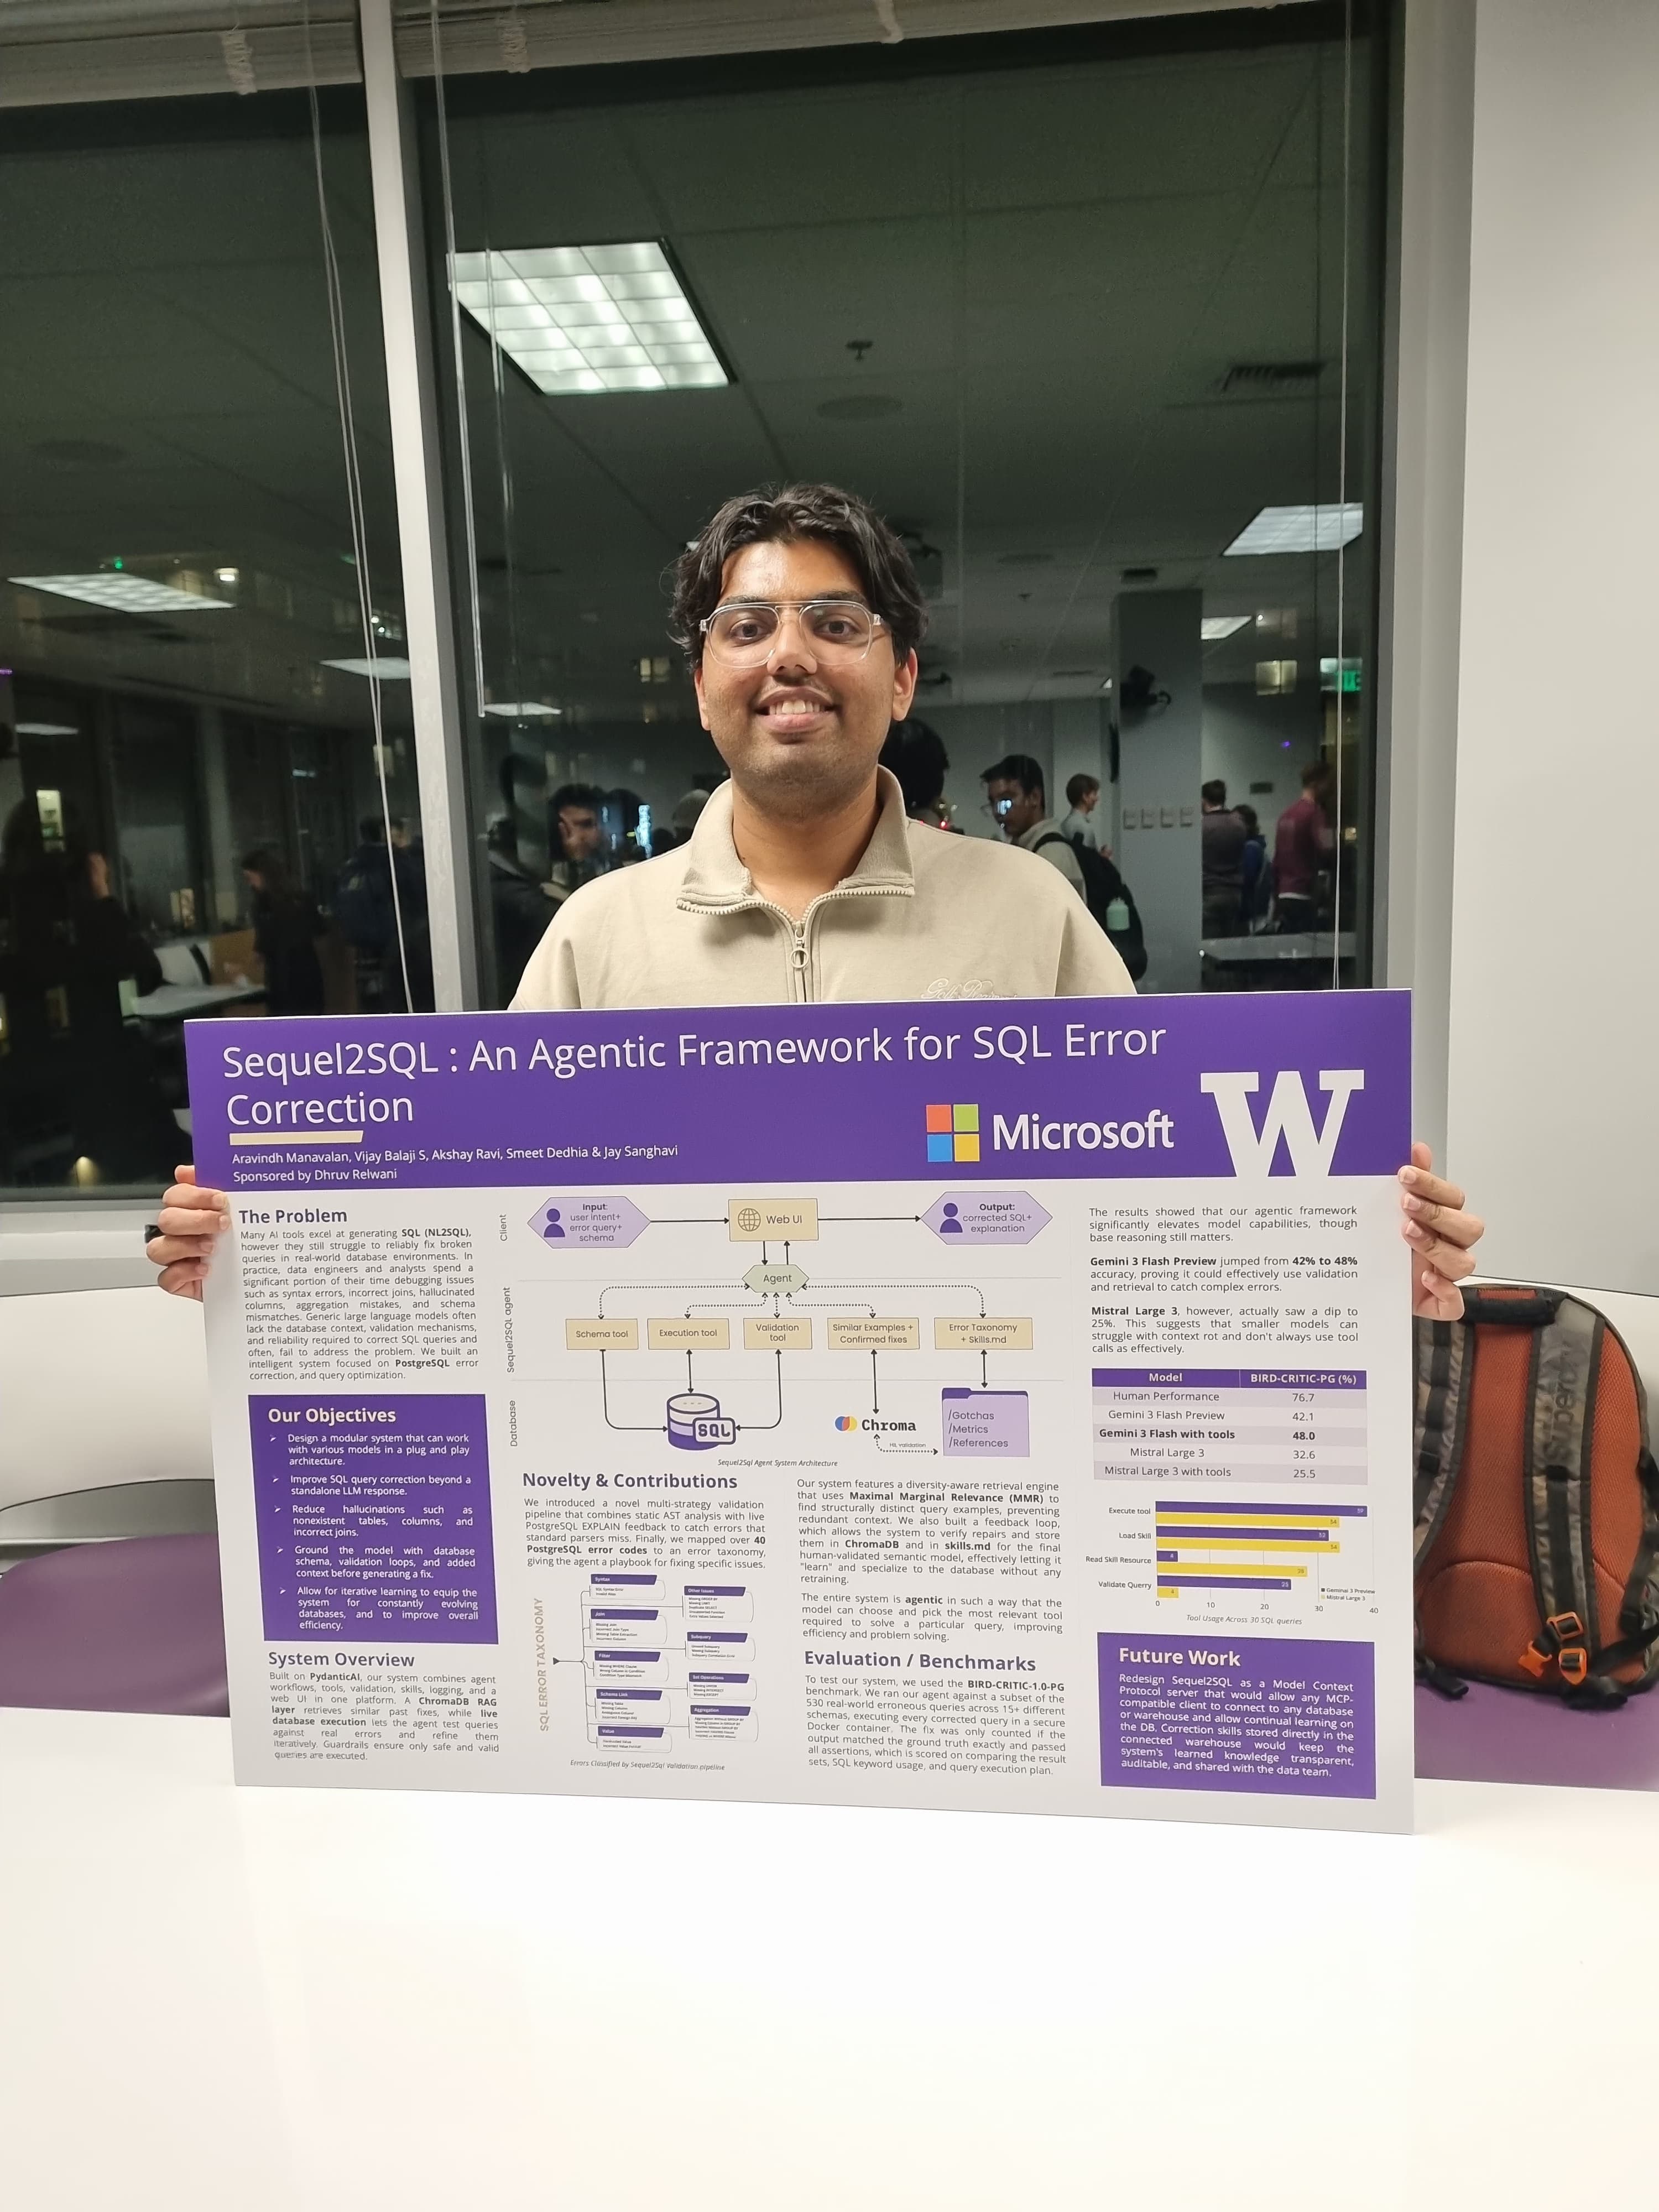
Sequel2SQL — AST Internals for Query Optimization
Microsoft Sponsored · University Capstone Project
- AST Transformation Passes: Built parsing and rewrite layers that work directly on the SQL AST at segment level. This let us apply targeted optimizations without blowing up memory on large queries.
- Optimizer Internals: Dug into how CTEs and window functions actually get planned and executed, then used that to guide the LLM and RAG optimization. Ended up 6% over baseline on BIRD-CRITIC.
Intuitive Surgical — GPU Inference Optimization
Software Engineer · Sunnyvale, CA
Got chat latency down from 90 seconds to 20 seconds by tuning the threading and batching configuration for the on-prem GPU setup. Ended up with a 4x throughput increase. Same core workflow as Dronaid: profile it first, then actually fix the real bottleneck.
- GPU Memory Tuning: Tuned KV cache sizing and continuous batching parameters to keep VRAM utilization high without OOM errors when multiple requests came in at once.
- Multi-threaded Batching: Batched concurrent requests to the on-prem GPUs to avoid per-token cloud API costs. Fixed-cost local inference scaled a lot better under load.
- Profiling First: Same approach as NSight and Linux perf at Dronaid: measure what is actually slow before touching anything. Guessing wastes time.
The Common Thread
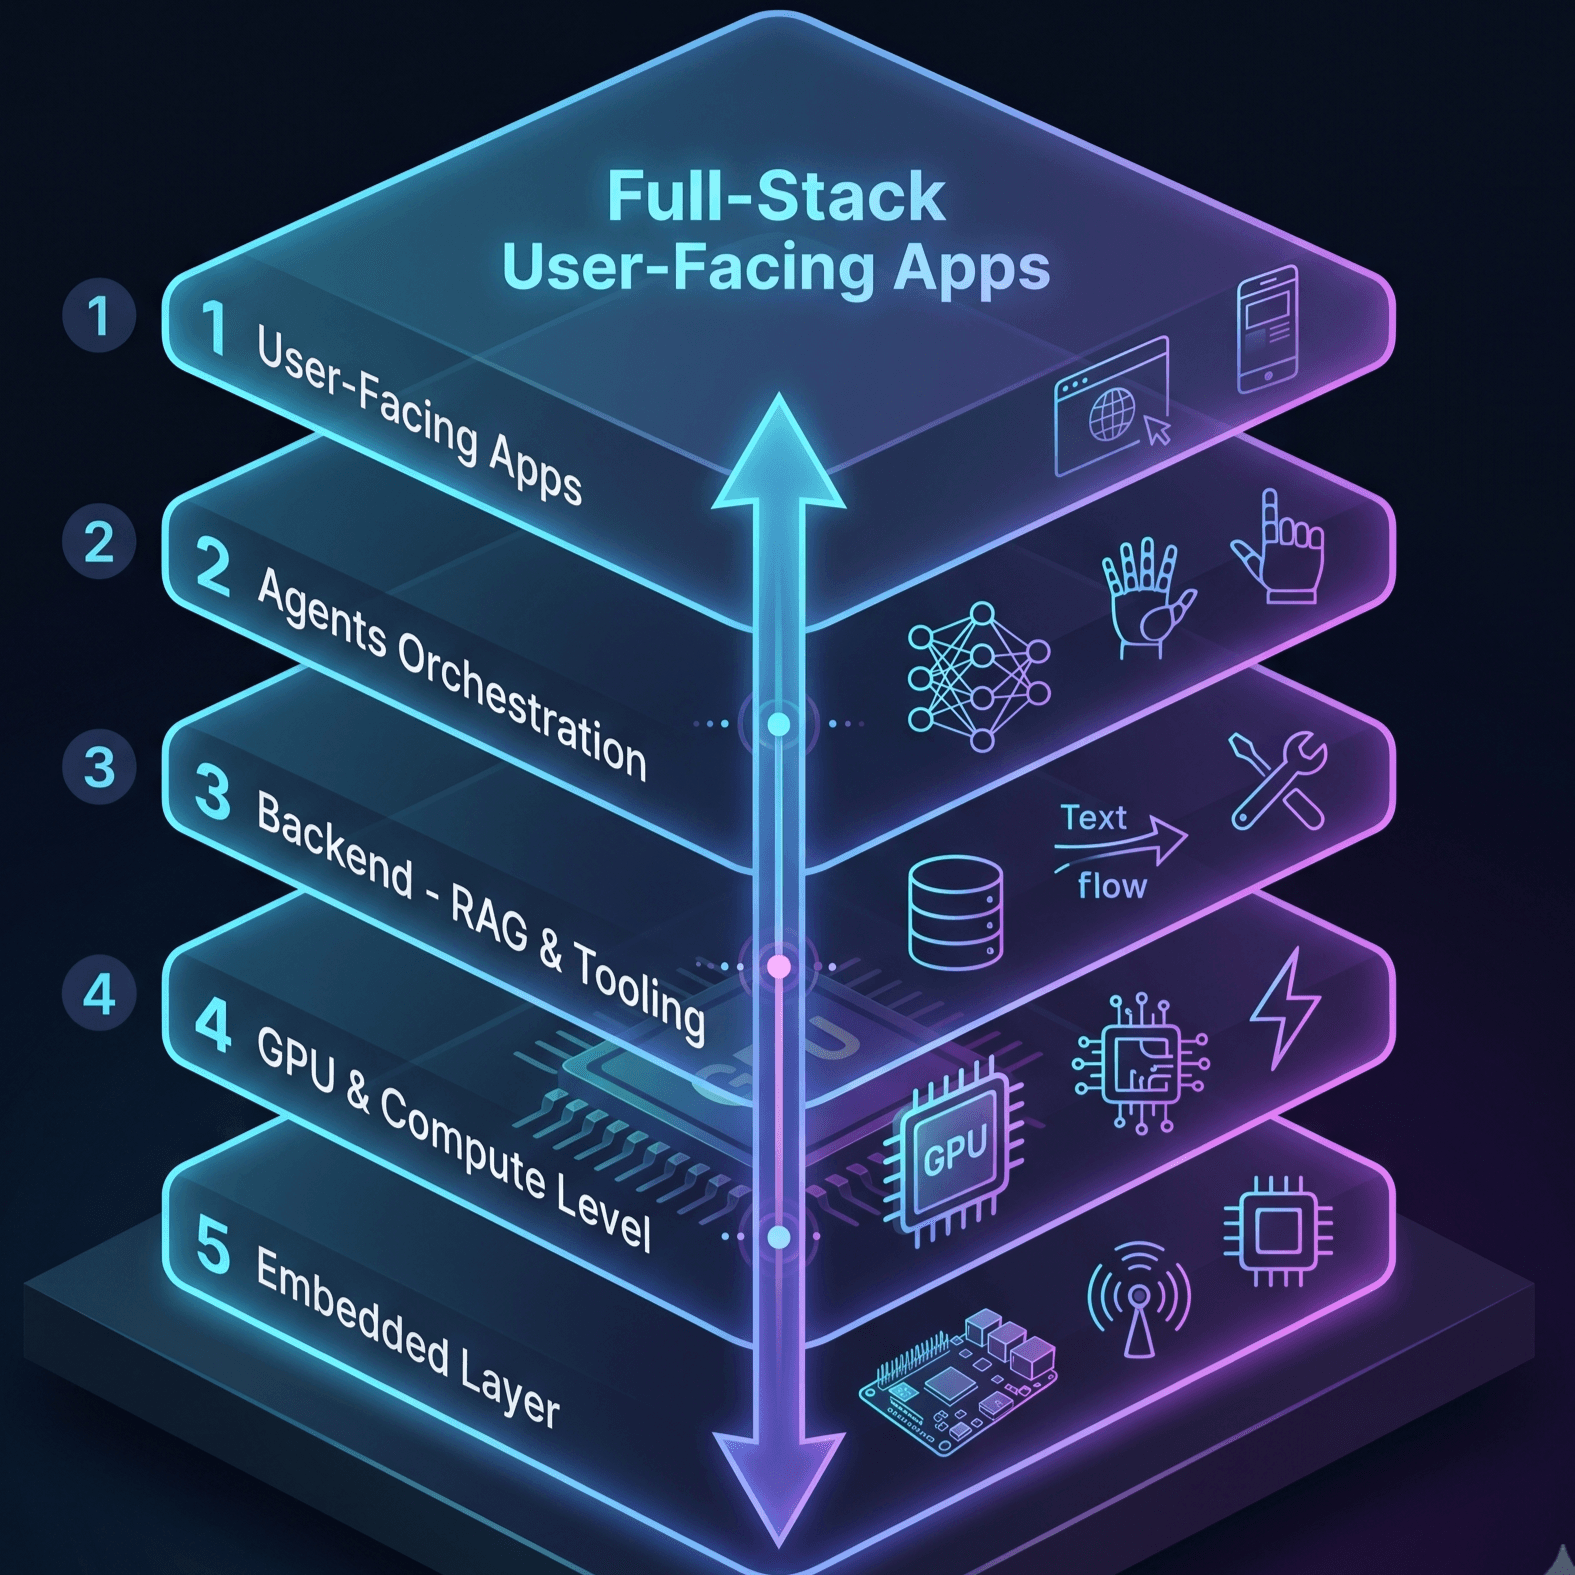
C++ RAII on a Jetson Nano, CUDA kernel coalescing in a lab, digging through a SQL query planner, tuning GPU memory batching for an LLM server. The approach that works in all of these is the same: go one level deeper than the abstraction and look at what is actually happening. That tends to be where the real gains are.